Cloudnet AWES 4주차 스터디를 진행하며 정리한 글입니다.
이번 포스팅에서는 쿠버네티스 환경에서 kube-prometheus-stack을 설치하고, 다양한 PromQL 쿼리를 이용하며 수집한 메트릭을 확인해보도록 하겠습니다.
kube-prometheus-stack 설치
# repo 추가
❯ helm repo add prometheus-community https://prometheus-community.github.io/helm-charts

# 파라미터 파일 생성
❯ cat <<EOT > monitor-values.yaml
prometheus:
  prometheusSpec:
    scrapeInterval: "15s"
    evaluationInterval: "15s"
    podMonitorSelectorNilUsesHelmValues: false
    serviceMonitorSelectorNilUsesHelmValues: false
    retention: 5d
    retentionSize: "10GiB"
    storageSpec:
      volumeClaimTemplate:
        spec:
          storageClassName: gp3
          accessModes: ["ReadWriteOnce"]
          resources:
            requests:
              storage: 30Gi

  ingress:
    enabled: true
    ingressClassName: alb
    hosts:
      - prometheus.$MyDomain
    paths:
      - /*
    annotations:
      alb.ingress.kubernetes.io/scheme: internet-facing
      alb.ingress.kubernetes.io/target-type: ip
      alb.ingress.kubernetes.io/listen-ports: '[{"HTTPS":443}, {"HTTP":80}]'
      alb.ingress.kubernetes.io/certificate-arn: $CERT_ARN
      alb.ingress.kubernetes.io/success-codes: 200-399
      alb.ingress.kubernetes.io/load-balancer-name: myeks-ingress-alb
      alb.ingress.kubernetes.io/group.name: study
      alb.ingress.kubernetes.io/ssl-redirect: '443'

grafana:
  defaultDashboardsTimezone: Asia/Seoul
  adminPassword: prom-operator

  ingress:
    enabled: true
    ingressClassName: alb
    hosts:
      - grafana.$MyDomain
    paths:
      - /*
    annotations:
      alb.ingress.kubernetes.io/scheme: internet-facing
      alb.ingress.kubernetes.io/target-type: ip
      alb.ingress.kubernetes.io/listen-ports: '[{"HTTPS":443}, {"HTTP":80}]'
      alb.ingress.kubernetes.io/certificate-arn: $CERT_ARN
      alb.ingress.kubernetes.io/success-codes: 200-399
      alb.ingress.kubernetes.io/load-balancer-name: myeks-ingress-alb
      alb.ingress.kubernetes.io/group.name: study
      alb.ingress.kubernetes.io/ssl-redirect: '443'

  persistence:
    enabled: true
    type: sts
    storageClassName: "gp3"
    accessModes:
      - ReadWriteOnce
    size: 20Gi

alertmanager:
  enabled: false
defaultRules:
  create: false
kubeControllerManager:
  enabled: false
kubeEtcd:
  enabled: false
kubeScheduler:
  enabled: false
prometheus-windows-exporter:
  prometheus:
    monitor:
      enabled: false
EOT

❯ helm install kube-prometheus-stack prometheus-community/kube-prometheus-stack --version 69.3.1 \
-f monitor-values.yaml --create-namespace --namespace monitoring
grafana와 prometheus가 잘 설치 되었고, ALB를 통해 도메인과 연결되어 라우팅 되는 것도 확인할 수 있었습니다.

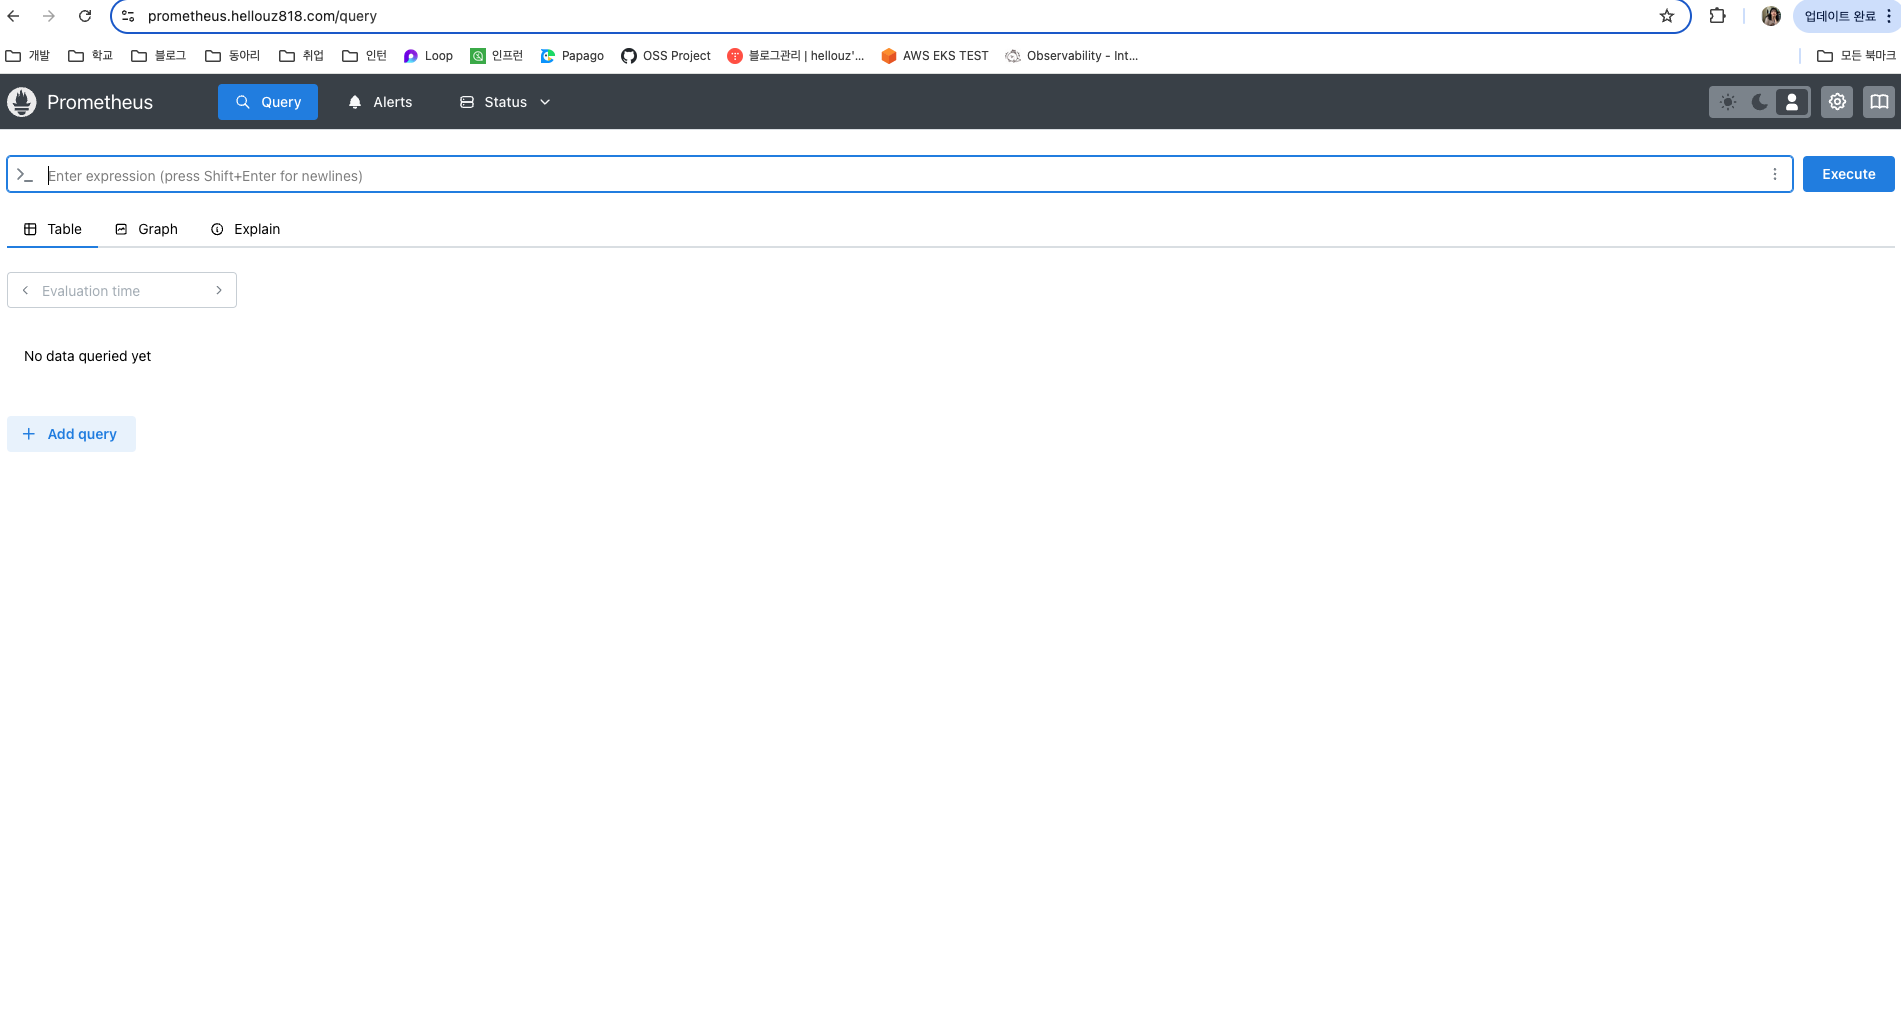
프로메테우스 대시보드 사용방법
프로메테우스의 모니터링 되는 서비스는 일반적으로 /metrics 엔드포인트 경로에 다양한 메트릭 정보를 노출시킵니다.
이후 프로메테우스는 해당 경로에 http get 방식으로 메트릭 정보를 가져와서 TSDB에 저장합니다.
- Query : PromQL을 통해 메트릭 정보를 조회
- Alerts : 사전에 정의한 경고 정책 (Prometheus rule)에 대한 상황
- Status : 프로메테우스 서버의 현재 상태 및 동작을 모니터링하는데 필요한 정보
- Monitoring Status (모니터링 상태)
- target health : 프로메테우스가 스크랩하고 있는 타켓 Exporter등의 상태 확인 (업다운, 스크랩 성공여부, 주기 등)
- rule health : 레코딩 규칙 및 알람 규칙 상태 확인
- service discovery : 자동으로 발견한 모니터링 대상 목록
- Server Status (서버 상태)
- Run & build information : 프로메테우스 버전, 빌드 시점, 실행 환경 등에 대한 정보
- TSDB status : TSDB 상태 (저장된 시계열 데이터 수, 활성화된 블록 수, 메모리 사용량 등)
- command-line flags : 커맨드라인 옵션 목록
- Configuration : 프로메테우스 설정파일 yaml 확인
- Alertmanager discovery : Alertmanager 인스턴스 목록
- Monitoring Status (모니터링 상태)
Configuration에서 지금 프로메테우스에 적용된 설정파일 정보로 어느 수집 주기를 가지는지, 어떤 걸 수집하는지 확인해보도록 하겠습니다.
global:
  scrape_interval: 15s # 메트릭 수집 주기
  scrape_timeout: 10s # 메트릭 타임 아웃
  scrape_protocols:
  - OpenMetricsText1.0.0
  - OpenMetricsText0.0.1
  - PrometheusText1.0.0
  - PrometheusText0.0.4
  evaluation_interval: 15s
  external_labels:
    prometheus: monitoring/kube-prometheus-stack-prometheus
    prometheus_replica: prometheus-kube-prometheus-stack-prometheus-0
runtime:
  gogc: 75
rule_files:
- /etc/prometheus/rules/prometheus-kube-prometheus-stack-prometheus-rulefiles-0/*.yaml
scrape_configs:
- job_name: serviceMonitor/monitoring/kube-prometheus-stack-apiserver/0 # kube-prometheus-stack-apiserver 에 대한 수집 메트릭 처리
  honor_timestamps: true
  track_timestamps_staleness: false
  scrape_interval: 15s
  scrape_timeout: 10s
  scrape_protocols:
  - OpenMetricsText1.0.0
  - OpenMetricsText0.0.1
  - PrometheusText1.0.0
  - PrometheusText0.0.4
  metrics_path: /metrics
  scheme: https
  enable_compression: true
아이고,, 헷갈렸던 부분이 target health에서 보이는 것과 service discovery에서 보이는 것이 달라서였는데 차이를 알게 되었습니다.
예를 들어 kube-prometheus-stack-apiserver라는 serviceMonitor는 쿠버네티스 API 서버의 메트릭 정보를 프로메테우스가 수집할 수 있도록 설정한 serviceMonitor입니다.
이 때 실제 target의 헬스체크에서는 프로메테우스가 API 서버의 메트릭을 잘 가져오고 있고, 모니터링 하는 대상은 2개임을 알 수 있습니다.
다만, service discovery에서 2/10으로 나오는데, 이 때 실제 자동적으로 발견한 대상은 일반 어플리케이션 파드에 관련된 메트릭도 있었습니다. 왜 그랬을까요?
service discovery는 프로메테우스가 감지한 모든 엔드포인트를 보여주는 페이지로, 모든 엔드포인트가 프로메테우스에서 수집되는 것은 아닙니다. 총 10개의 엔드포인트를 발견했지만, 실제로 모니터링 중인 타켓은 2개라는 의미입니다.


Prometheus가 kube-prometheus-stack-apiserver ServiceMonitor를 통해 감지한 Kubernetes API Server (kube-apiserver)의 엔드포인트는 각 클러스터의 kube-apiserver 서비스가 실행되는 노드(컨트롤 플레인 노드)의 IP 주소입니다.
이 때, EKS는 컨트롤 플레인을 AWS에서 관리해서 직접 사용자가 컨트롤 플레인을 볼 수 는 없지만, 컨트롤 플레인이 2개로 보이는 것은 실제로 내부적으로 2개의 API 서버를 운영하거나, 부하 분산을 위해 여러 개의 엔드포인트를 제공하는 것일 가능성이 크다고 합니다.
❯ kubectl get endpoints kubernetes
NAME         ENDPOINTS                             AGE
kubernetes   192.168.2.222:443,192.168.3.105:443   11h
AWS EKS Control Plane의 scheduler, controller-manager 메트릭 수집
현재 target 대상을 확인해보면
apiserver, coredns, kube-proxy, kube-state-metrics, kubelet, kube-prometheus-stack-operator, node-exporter, prometheus에 대해서만 pulling을 하고 있습니다.
그렇다면, EKS Control plane에서 scheduler와 controller manager에 대해서는 메트릭 수집을 할 수 없을까요?
(kube-apiserversms kubernetes 서비스로 접근이 가능하지만, scheduler랑 controller-manager는 내부적으로만 실행됩니다.)
일반 API 서버의 /metrics 엔드포인트는 특정 메트릭을 살펴볼 때 유용합니다.
Kubernetes 버전 1.28이상인 클러스터의 경우 Amazon EKS는 API 그룹 하위 메트릭(metrics.eks.amazonaws.com)도 노출합니다. 이러한 메트릭에는 kube-scheduler, kube-controller-manager과 같은 같은 컨트롤 플레인 컴포넌트도 포함됩니다.
만약 프로메테우스에서 해당 엔드포인트에 대해 스크랩하고 싶다면, scrape_config에 scrape job을 추가하면 될 것으로 보입니다.
https://docs.aws.amazon.com/eks/latest/userguide/view-raw-metrics.html
Fetch control plane raw metrics in Prometheus format - Amazon EKS
If you have a webhook configuration that could block the creation of the new APIService resource v1.metrics.eks.amazonaws.com on your cluster, the metrics endpoint feature might not be available. You can verify that in the kube-apiserver audit log by searc
docs.aws.amazon.com
❯ kubectl get --raw /metrics
rest_client_response_size_bytes_count{host="localhost:10277",verb="POST"} 3824
rest_client_response_size_bytes_bucket{host="localhost:21362",verb="POST",le="64"} 0
rest_client_response_size_bytes_bucket{host="localhost:21362",verb="POST",le="256"} 0
rest_client_response_size_bytes_bucket{host="localhost:21362",verb="POST",le="512"} 128
...

# kube-scheduler 메트릭
❯ kubectl get --raw "/apis/metrics.eks.amazonaws.com/v1/ksh/container/metrics"
# HELP scheduler_pending_pods [STABLE] Number of pending pods, by the queue type. 'active' means number of pods in activeQ; 'backoff' means number of pods in backoffQ; 'unschedulable' means number of pods in unschedulablePods that the scheduler attempted to schedule and failed; 'gated' is the number of unschedulable pods that the scheduler never attempted to schedule because they are gated.
# TYPE scheduler_pending_pods gauge
scheduler_pending_pods{queue="active"} 0
scheduler_pending_pods{queue="backoff"} 0
scheduler_pending_pods{queue="gated"} 0
scheduler_pending_pods{queue="unschedulable"} 0
# HELP scheduler_pod_scheduling_attempts [STABLE] Number of attempts to successfully schedule a pod.
# TYPE scheduler_pod_scheduling_attempts histogram
scheduler_pod_scheduling_attempts_bucket{le="1"} 0
scheduler_pod_scheduling_attempts_bucket{le="2"} 0
scheduler_pod_scheduling_attempts_bucket{le="4"} 0
scheduler_pod_scheduling_attempts_bucket{le="8"} 0
scheduler_pod_scheduling_attempts_bucket{le="16"} 0
scheduler_pod_scheduling_attempts_bucket{le="+Inf"} 0
scheduler_pod_scheduling_attempts_sum 0
scheduler_pod_scheduling_attempts_count 0
# HELP scheduler_preemption_attempts_total [STABLE] Total preemption attempts in the cluster till now
# TYPE scheduler_preemption_attempts_total counter
scheduler_preemption_attempts_total 0
# HELP scheduler_preemption_victims [STABLE] Number of selected preemption victims
# TYPE scheduler_preemption_victims histogram
scheduler_preemption_victims_bucket{le="1"} 0
scheduler_preemption_victims_bucket{le="2"} 0
scheduler_preemption_victims_bucket{le="4"} 0
scheduler_preemption_victims_bucket{le="8"} 0

# kube-controller-manager 메트릭
❯ kubectl get --raw "/apis/metrics.eks.amazonaws.com/v1/kcm/container/metrics"
# HELP workqueue_adds_total [ALPHA] Total number of adds handled by workqueue
# TYPE workqueue_adds_total counter
workqueue_adds_total{name="DynamicConfigMapCABundle-client-ca"} 1436
workqueue_adds_total{name="DynamicServingCertificateController"} 719
workqueue_adds_total{name="RequestHeaderAuthRequestController"} 1
# HELP workqueue_depth [ALPHA] Current depth of workqueue
# TYPE workqueue_depth gauge
workqueue_depth{name="DynamicConfigMapCABundle-client-ca"} 0
workqueue_depth{name="DynamicServingCertificateController"} 0
workqueue_depth{name="RequestHeaderAuthRequestController"} 0
# HELP workqueue_queue_duration_seconds [ALPHA] How long in seconds an item stays in workqueue before being requested.
# TYPE workqueue_queue_duration_seconds histogram
workqueue_queue_duration_seconds_bucket{name="DynamicConfigMapCABundle-client-ca",le="1e-08"} 0
workqueue_queue_duration_seconds_bucket{name="DynamicConfigMapCABundle-client-ca",le="1e-07"} 0
workqueue_queue_duration_seconds_bucket{name="DynamicConfigMapCABundle-client-ca",le="1e-06"} 0
workqueue_queue_duration_seconds_bucket{name="DynamicConfigMapCABundle-client-ca",le="9.999999999999999e-06"} 1346
workqueue_queue_duration_seconds_bucket{name="DynamicConfigMapCABundle-client-ca",le="9.999999999999999e-05"} 1432
workqueue_queue_duration_seconds_bucket{name="DynamicConfigMapCABundle-client-ca",le="0.001"} 1434
workqueue_queue_duration_seconds_bucket{name="DynamicConfigMapCABundle-client-ca",le="0.01"} 1434
workqueue_queue_duration_seconds_bucket{name="DynamicConfigMapCABundle-client-ca",le="0.1"} 1436
workqueue_queue_duration_seconds_bucket{name="DynamicConfigMapCABundle-client-ca",le="1"} 1436
workqueue_queue_duration_seconds_bucket{name="DynamicConfigMapCABundle-client-ca",le="10"} 1436
workqueue_queue_duration_seconds_bucket{name="DynamicConfigMapCABundle-client-ca",le="+Inf"} 1436
workqueue_queue_duration_seconds_sum{name="DynamicConfigMapCABundle-client-ca"} 0.20809325699999992
workqueue_queue_duration_seconds_count{name="DynamicConfigMapCABundle-client-ca"} 1436
workqueue_queue_duration_seconds_bucket{name="DynamicServingCertificateController",le="1e-08"} 0
workqueue_queue_duration_seconds_bucket{name="DynamicServingCertificateController",le="1e-07"} 0
workqueue_queue_duration_seconds_bucket{name="DynamicServingCertificateController",le="1e-06"} 0
workqueue_queue_duration_seconds_bucket{name="DynamicServingCertificateController",le="9.999999999999999e-06"} 11
AWS EKS CNI Metrics 수집
AWS에서는 CNI로 VPC-CNI를 사용합니다. 이 설정은 aws-node 파드에 들어가있죠. 따라서 AWS EKS CNI에 대한 메트릭을 수집하고 싶다면, aws-node에 대한 PodMonitor를 배포하면 됩니다.
# PodMonitor 배포
❯ cat <<EOF | kubectl create -f -
apiVersion: monitoring.coreos.com/v1
kind: PodMonitor
metadata:
  name: aws-cni-metrics
  namespace: kube-system
spec:
  jobLabel: k8s-app
  namespaceSelector:
    matchNames:
    - kube-system
  podMetricsEndpoints:
  - interval: 30s
    path: /metrics
    port: metrics
  selector:
    matchLabels:
      k8s-app: aws-node
EOF

# PodMonitor 확인
❯ kubectl get podmonitor -n kube-system
❯ kubectl get podmonitor -n kube-system aws-cni-metrics -o yaml | kubectl neat

# metrics url 접속 확인
❯ curl -s $N1:61678/metrics | grep '^awscni'
awscni_add_ip_req_count 11
awscni_assigned_ip_addresses 8
awscni_assigned_ip_per_cidr{cidr="192.168.1.123/32"} 1
awscni_assigned_ip_per_cidr{cidr="192.168.1.139/32"} 1
awscni_assigned_ip_per_cidr{cidr="192.168.1.14/32"} 1
awscni_assigned_ip_per_cidr{cidr="192.168.1.21/32"} 0
awscni_assigned_ip_per_cidr{cidr="192.168.1.222/32"} 1
awscni_assigned_ip_per_cidr{cidr="192.168.1.227/32"} 1
awscni_assigned_ip_per_cidr{cidr="192.168.1.236/32"} 1
awscni_assigned_ip_per_cidr{cidr="192.168.1.4/32"} 1
awscni_assigned_ip_per_cidr{cidr="192.168.1.92/32"} 1
awscni_assigned_ip_per_eni{eni="eni-087024b16973016df"} 2
awscni_assigned_ip_per_eni{eni="eni-0a2342b642db635c3"} 1
awscni_assigned_ip_per_eni{eni="eni-0f95bf034923b2f78"} 5
awscni_aws_api_latency_ms_sum{api="AssignPrivateIpAddresses",error="false",status="200"} 386
awscni_aws_api_latency_ms_count{api="AssignPrivateIpAddresses",error="false",status="200"} 1
awscni_aws_api_latency_ms_sum{api="AttachNetworkInterface",error="false",status="200"} 1636
awscni_aws_api_latency_ms_count{api="AttachNetworkInterface",error="false",status="200"} 2
awscni_aws_api_latency_ms_sum{api="CreateNetworkInterface",error="false",status="200"} 917
awscni_aws_api_latency_ms_count{api="CreateNetworkInterface",error="false",status="200"} 2
awscni_aws_api_latency_ms_sum{api="CreateTags",error="false",status="200"} 141
awscni_aws_api_latency_ms_count{api="CreateTags",error="false",status="200"} 1
awscni_aws_api_latency_ms_sum{api="DescribeInstances",error="false",status="200"} 272
awscni_aws_api_latency_ms_count{api="DescribeInstances",error="false",status="200"} 2
awscni_aws_api_latency_ms_sum{api="DescribeNetworkInterfaces",error="false",status="200"} 210
awscni_aws_api_latency_ms_count{api="DescribeNetworkInterfaces",error="false",status="200"} 1
awscni_aws_api_latency_ms_sum{api="DescribeSubnets",error="false",status="200"} 466
awscni_aws_api_latency_ms_count{api="DescribeSubnets",error="false",status="200"} 2
awscni_aws_api_latency_ms_sum{api="GetMetadata",error="false",status="200"} 8710
awscni_aws_api_latency_ms_count{api="GetMetadata",error="false",status="200"} 18579
awscni_aws_api_latency_ms_sum{api="GetMetadata",error="true",status="404"} 956
awscni_aws_api_latency_ms_count{api="GetMetadata",error="true",status="404"} 2138
awscni_aws_api_latency_ms_sum{api="ModifyNetworkInterfaceAttribute",error="false",status="200"} 1247
awscni_aws_api_latency_ms_count{api="ModifyNetworkInterfaceAttribute",error="false",status="200"} 3
awscni_aws_api_latency_ms_sum{api="waitForENIAndIPsAttached",error="false",status="200"} 1699
awscni_aws_api_latency_ms_count{api="waitForENIAndIPsAttached",error="false",status="200"} 2
awscni_build_info{goversion="go1.22.12",version=""} 1
awscni_del_ip_req_count{reason="PodDeleted"} 9
awscni_ec2api_req_count{fn="AssignPrivateIpAddresses"} 1
awscni_ec2api_req_count{fn="AttachNetworkInterface"} 2
awscni_ec2api_req_count{fn="CreateNetworkInterface"} 2
awscni_ec2api_req_count{fn="CreateTags"} 1
awscni_ec2api_req_count{fn="DescribeInstances"} 2
awscni_ec2api_req_count{fn="DescribeNetworkInterfaces"} 13
awscni_ec2api_req_count{fn="DescribeSubnets"} 2
awscni_ec2api_req_count{fn="ModifyNetworkInterfaceAttribute"} 3
awscni_eni_allocated 3
awscni_eni_max 3
awscni_force_removed_enis 0
awscni_force_removed_ips 0
awscni_ip_max 15
awscni_ipamd_action_inprogress{fn="increaseDatastorePool"} 0
awscni_ipamd_action_inprogress{fn="nodeIPPoolReconcile"} 0
awscni_ipamd_action_inprogress{fn="nodeInit"} 0
awscni_no_available_ip_addresses 0
awscni_reconcile_count{fn="eniDataStorePoolReconcileAdd"} 10615
awscni_total_ip_addresses 15
추가적으로, 해당 메트릭을 Grafana에서 예쁘게 볼 수 있는 대시보드도 있습니다.
https://grafana.com/grafana/dashboards/16032-aws-cni-metrics/
AWS CNI Metrics | Grafana Labs
The AWS VPC CNI, found on EKS, exposes metrics that can be collected in Prometheus. This is not the case by default, AWS favoring CloudWatch, so you’ll have to add a podMonitor matching the aws-node daemonset: apiVersion: monitoring.coreos.com/v1 kind: P
grafana.com
PromQL 활용하기
이제, 프로메테우스 대시보드에서 메트릭을 Graph로 조회해보며, 메트릭 값과 프로메테우스에서 사용하는 쿼리문에 대한 이해를 해보겠습니다.
node_cpu_seconds_total에 대한 메트릭으로 확인해보겠습니다. 해당 메트릭은 특정 모드별로 CPU가 소비한 총 시간을 초 단위로 측정한 값입니다.
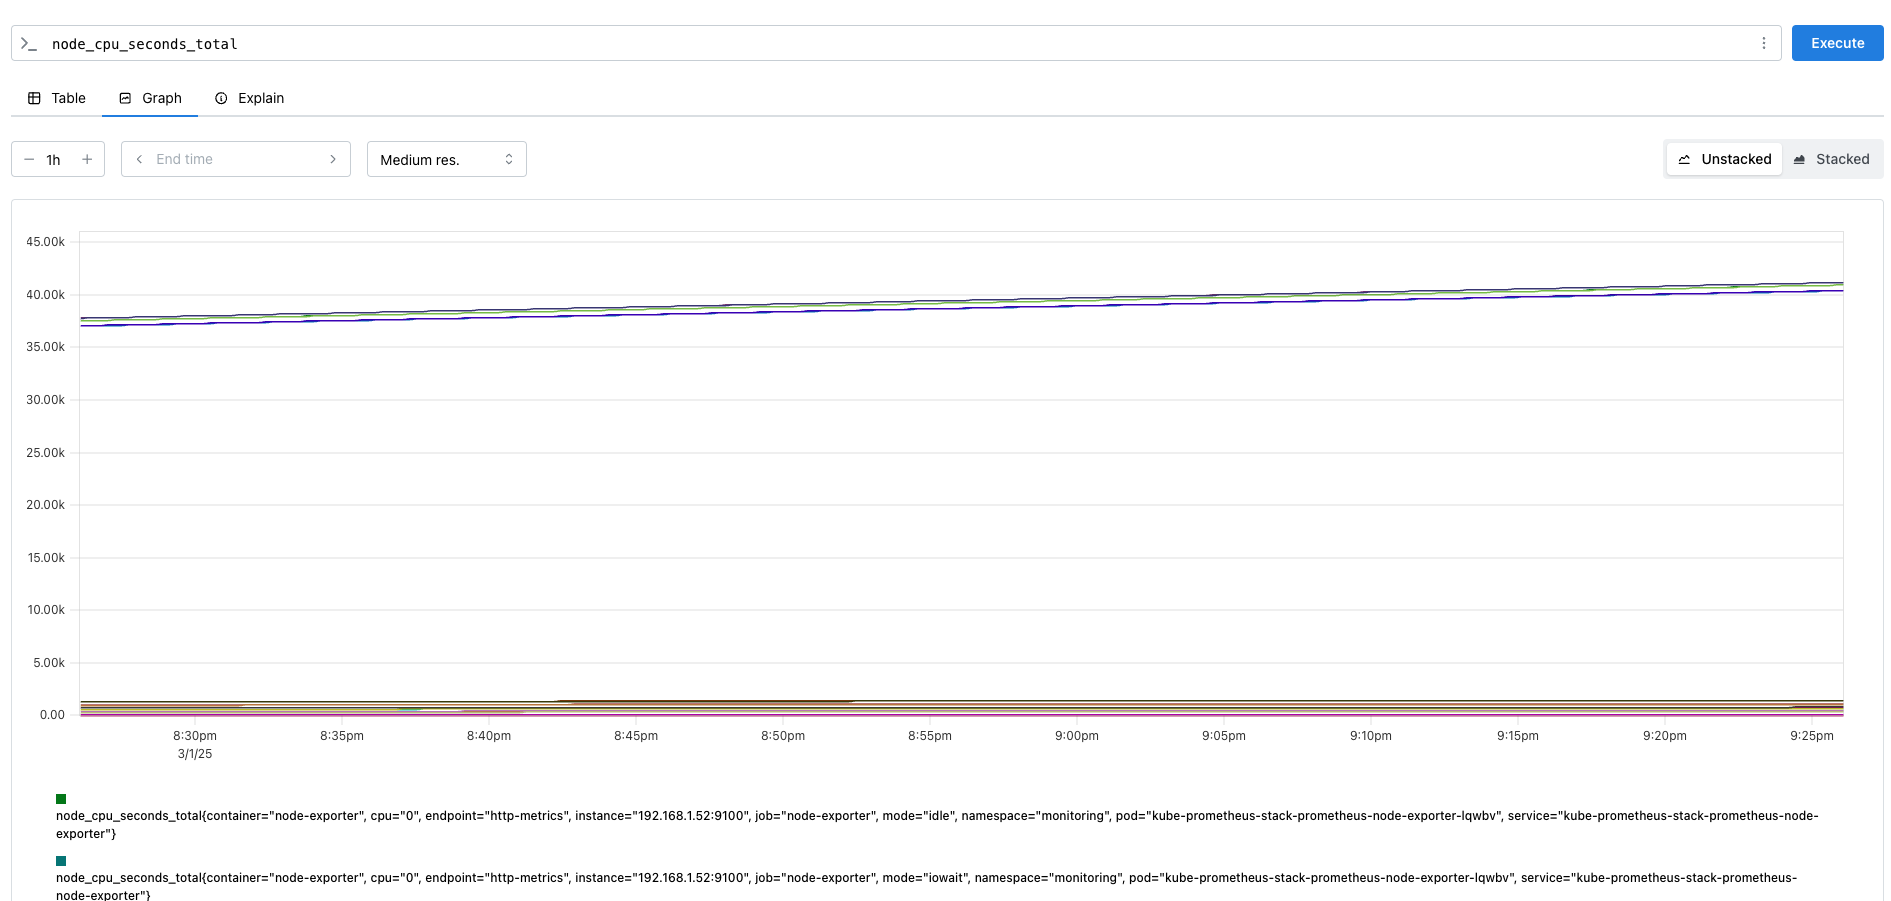


하지만 (node_cpu_seconds_total{mode="idle"}[1m])는 값을 반환하지 못했습니다.
그 이유는 프롬쿼리(PromQL)에서 [1m]는 범위 벡터(range vector) 선택자인데, 범위 벡터를 단순히 조회할 수 없습니다.
따라서, 이러한 경우네는 rate(), avg_over_time()과 같은 함수를 사용해야합니다.
다음과 같이 1분평균 CPU Idle 비율을 확인하는 쿼리는 정상 수행된 것을 확인할 수 있습니다.
++ Time Series Selector
- Instance Vector : 시점에 대한 메트릭 값만 가지는 타입
- Range Vector : 시간의 구간을 가지는 타입

node exporter
리눅스 서버의 하드웨어 및 시스템 리소스 관련 메트릭을 수집하는 익스포터입니다.
Node exporter는 /proc, /sys에서 다양한 정보를 가져오는 collector를 사용합니다.
1) CPU Collector
/proc/stat 파일에서 CPU 관련 정보를 가져옵니다.
CPU의 상태별 시간(Idle, user, system, iowait 등)을 측정합니다.
ex)
- node_cpu_seconds_total{mode="idle"} → 1362393초
- node_cpu_seconds_total{mode="user"} → 4695초
2) Diskstats Collector
/proc/diskstats 파일에서 디스크 I/O상태를 수집합니다.
디스크 사용량, 읽기쓰기 횟수, I/O 대기 시간등을 측정합니다.
ex)
- node_disk_reads_completed_total → 124335 (디스크 읽기 완료 횟수)
- node_disk_writes_completed_total → 181373 (디스크 쓰기 완료 횟수)
- node_disk_io_time_seconds_total → 932412 (총 디스크 I/O 시간)
3) Filesystem Collector
/proc/mounts, /sys/fs/cgroup, /proc/diskstats 등을 활용해 파일 시스템 정보를 수집합니다.
마운트된 파일 시스템별 사용량을 보여줍니다.
ex)
- node_filesystem_size_bytes{mountpoint="/"} 500000000000
- node_filesystem_free_bytes{mountpoint="/"} 200000000000
4) Memeory Collector
/proc/meminfo 파일을 읽어 총 메모리, 사용 가능한 메모리, 캐시, 스왑 정보를 제공합니다.
ex)
- node_memory_MemTotal_bytes 16777216
- node_memory_MemAvailable_bytes 8388608
- node_memory_Cached_bytes 4194304
5) Load Average, Update 등등
kube-state-metrics exporter
쿠버네티스 리소스(pod, deployment, node, namespace)의 상태 정보를 제공합니다.
ex)
- kube_pod_status_phase : 각 Pod의 태 (Pending, Running, Succeeded, Failed)
- kube_pod_container_status_restarts_total : 컨테이너 재시작 횟수
- kube_node_status_ready : 노드가 Ready 상태인지 확인 (1 = Ready)
- kube_deployment_status_replicas_available : Deployment에서 사용 가능한 Replica 수
- kube_service_spec_type : Service의 Type (ClusterIP, NodePort, LoadBalancer)
- kube_namespace_status_phase : 네임스페이스의 상태 (Active, Terminating)

kube-proxy exporter
쿠버네티스에서 service와 Pod간의 네트워크 라우팅을 담당할 때, iptables, ipvs 등 네트워크 라우팅을 관리하고 모니터링하는 메트릭을 제공합니다.
ex)
- kubeproxy_network_programming_duration_seconds : 네트워크 규칙(iptables/IPVS) 적용에 걸린 시간
- kubeproxy_sync_proxy_rules_duration_seconds : kube-proxy가 iptables 규칙을 동기화하는 데 걸린 시간
- kubeproxy_sync_proxy_rules_count : kube-proxy의 프로세스가 iptables/ipvs 규칙을 몇 번 업데이트했는지
- kubeproxy_total_sync_proxy_rules_duration_seconds : kube-proxy가 iptables/ipvs 규칙을 완전히 동기화하는 데 걸린 총 시간

이러한 EKS 기본 Exporter 말고, 내가 배포하고자 하는 서비스에 대해서 Exporter를 추가하여 프로메테우스로 모니터링 할 수 있습니다.
어플리케이션 ServiceMonitor, Exporter

nginx 웹서버에 metrics 수집 설정을 추가합니다.
기존에는 nginx를 수집할 수 있는 target이 없었습니다.

# 모니터링
❯ watch -d "kubectl get pod; echo; kubectl get servicemonitors -n monitoring"

# nginx 파드내에 컨테이너 갯수 확인
❯ kubectl describe pod -l app.kubernetes.io/instance=nginx
1개 있음 (nginx)

# 서비스 모니터 방식으로 nginx 모니터링 대상을 등록하고, export 는 9113 포트 사용
cat <<EOT > nginx-values.yaml
metrics:
  enabled: true

  service:
    port: 9113

  serviceMonitor:
    enabled: true
    namespace: monitoring
    interval: 10s
EOT

# 배포
helm upgrade nginx bitnami/nginx --reuse-values -f nginx-values.yaml

# 확인
kubectl get pod,svc,ep | grep nginx
❯ kubectl get pod,svc,ep | grep nginx
pod/nginx-85df7754bf-dr6pm           2/2     Running   0          51s
service/nginx         NodePort    10.100.80.120    <none>        80:31818/TCP,443:31903/TCP,9113:32378/TCP   3h55m
endpoints/nginx         192.168.1.21:9113,192.168.1.21:8443,192.168.1.21:8080      3h55m


# [운영서버 EC2] 메트릭 확인 >> 프로메테우스에서 Target 확인
**## nginx sub_status url 접속해보기**
NGINXIP=$(kubectl get pod -l app.kubernetes.io/instance=nginx -o jsonpath="{.items[0].status.podIP}")
curl -s http://$NGINXIP:9113/metrics # nginx_connections_active Y 값 확인해보기
curl -s http://$NGINXIP:9113/metrics | grep nginx
# HELP nginx_connections_accepted Accepted client connections
# TYPE nginx_connections_accepted counter
nginx_connections_accepted 80
# HELP nginx_connections_active Active client connections
# TYPE nginx_connections_active gauge
nginx_connections_active 1
# HELP nginx_connections_handled Handled client connections
# TYPE nginx_connections_handled counter
nginx_connections_handled 80
# HELP nginx_connections_reading Connections where NGINX is reading the request header
# TYPE nginx_connections_reading gauge
nginx_connections_reading 0
# HELP nginx_connections_waiting Idle client connections
# TYPE nginx_connections_waiting gauge
nginx_connections_waiting 0
# HELP nginx_connections_writing Connections where NGINX is writing the response back to the client
# TYPE nginx_connections_writing gauge
nginx_connections_writing 1
# HELP nginx_exporter_build_info A metric with a constant '1' value labeled by version, revision, branch, goversion from which nginx_exporter was built, and the goos and goarch for the build.
# TYPE nginx_exporter_build_info gauge
nginx_exporter_build_info{branch="HEAD",goarch="amd64",goos="linux",goversion="go1.22.12",revision="8da901c87176210a4951f427742c05bfa96c838f",tags="unknown",version="1.4.1"} 1
# HELP nginx_http_requests_total Total http requests
# TYPE nginx_http_requests_total counter
nginx_http_requests_total 102
# HELP nginx_up Status of the last metric scrape
# TYPE nginx_up gauge
nginx_up 1

curl -s http://$NGINXIP:9113/metrics | grep ^nginx_connections_active

# nginx 파드내에 컨테이너 갯수 확인 : metrics 컨테이너 확인
kubectl get pod -l app.kubernetes.io/instance=nginx
2개 있음 (metrics, nginx)


# 접속 주소 확인 및 접속
echo -e "Nginx WebServer URL = https://nginx.$MyDomain"
curl -s https://nginx.$MyDomain
kubectl stern deploy/nginx

# 반복 접속
while true; do curl -s https://nginx.$MyDomain -I | head -n 1; date; sleep 1; done
하지만, 배포 후 serviceMonitor가 9113 포트, container도 metrics 컨테이너에 대해 노출된 것을 볼 수 있습니다.
(위에 배포한 serviceMonitor는, monitoring 네임스페이스에 배포된다는 것일뿐, 실제 메트릭 수집대상과는 관련이 없어서 다른 네임스페이스에 있는 서비스를 수집할 수도 있습니다.)

'스터디 > AEWS' 카테고리의 다른 글
| [AEWS] 5주차 쿠버네티스 오토스케일링 이해하기 - 수평 확장 (HPA, KEDA) (0) | 2025.03.08 |
|---|---|
| [AEWS] 4주차 Grafana 이해하기 (0) | 2025.03.02 |
| [AEWS] 4주차 Kubernetes 이상징후에 알람 받기 (kwatch, botkube) (1) | 2025.03.02 |
| [AEWS] 4주차 CloudWatch를 활용한 EKS 모니터링 - Container Insights 활용하기 (0) | 2025.03.02 |
| [AEWS] 4주차 EKS 로깅 (컨트롤 플레인, 데이터 플레인) (0) | 2025.03.02 |