Cloudnet Cilium 7주차 스터디를 진행하며 정리한 글입니다.
이번 포스팅에서는 Cilium Metrics 대시보드를 살펴보고, 간단한 쿼리문을 확인해보겠습니다.
실습 환경 준비
kind 클러스터에 cilium cni를 비롯한 필요한 컴포넌트를 설치하겠습니다.
# Prometheus Target connection refused bind-address 설정 : kube-controller-manager , kube-scheduler , etcd , kube-proxy
> kind create cluster --name myk8s --image kindest/node:v1.33.2 --config - <<EOF
kind: Cluster
apiVersion: kind.x-k8s.io/v1alpha4
nodes:
- role: control-plane
  extraPortMappings:
  - containerPort: 30000
    hostPort: 30000
  - containerPort: 30001
    hostPort: 30001
  - containerPort: 30002
    hostPort: 30002
  - containerPort: 30003
    hostPort: 30003
  kubeadmConfigPatches: # Prometheus Target connection refused bind-address 설정
  - |
    kind: ClusterConfiguration
    controllerManager:
      extraArgs:
        bind-address: 0.0.0.0
    etcd:
      local:
        extraArgs:
          listen-metrics-urls: http://0.0.0.0:2381
    scheduler:
      extraArgs:
        bind-address: 0.0.0.0
  - |
    kind: KubeProxyConfiguration
    metricsBindAddress: 0.0.0.0
networking:
  disableDefaultCNI: true
  kubeProxyMode: none
  podSubnet: "10.244.0.0/16"   # cluster-cidr
kubeadmConfigPatches:
- |
  kind: ClusterConfiguration
  controllerManager:
    extraArgs:
      allocate-node-cidrs: "true"
      cluster-cidr: "10.244.0.0/16"
      node-cidr-mask-size: "22"
EOF

# node 별 PodCIDR 확인
> kubectl get nodes -o jsonpath='{.items[*].spec.podCIDR}'
10.244.0.0/22

# cilium cni 설치
> cilium install --version 1.18.1 --set ipam.mode=kubernetes --set ipv4NativeRoutingCIDR=172.20.0.0/16 \
--set routingMode=native --set autoDirectNodeRoutes=true --set endpointRoutes.enabled=true --set directRoutingSkipUnreachable=true \
--set kubeProxyReplacement=true --set bpf.masquerade=true \
--set endpointHealthChecking.enabled=false --set healthChecking=false \
--set hubble.enabled=true --set hubble.relay.enabled=true --set hubble.ui.enabled=true \
--set hubble.ui.service.type=NodePort --set hubble.ui.service.nodePort=30003 \
--set prometheus.enabled=true --set operator.prometheus.enabled=true --set envoy.prometheus.enabled=true --set hubble.metrics.enableOpenMetrics=true \
--set hubble.metrics.enabled="{dns,drop,tcp,flow,port-distribution,icmp,httpV2:exemplars=true;labelsContext=source_ip\,source_namespace\,source_workload\,destination_ip\,destination_namespace\,destination_workload\,traffic_direction}" \
--set debug.enabled=true  # --dry-run-helm-values

# hubble ui
> open http://127.0.0.1:30003


# metrics-server
> helm repo add metrics-server https://kubernetes-sigs.github.io/metrics-server/
> helm upgrade --install metrics-server metrics-server/metrics-server --set 'args[0]=--kubelet-insecure-tls' -n kube-system


# Install Prometheus & Grafana
> kubectl apply -f https://raw.githubusercontent.com/cilium/cilium/1.18.1/examples/kubernetes/addons/prometheus/monitoring-example.yaml

# NodePort 설정
> kubectl patch svc -n cilium-monitoring prometheus -p '{"spec": {"type": "NodePort", "ports": [{"port": 9090, "targetPort": 9090, "nodePort": 30001}]}}'
> kubectl patch svc -n cilium-monitoring grafana -p '{"spec": {"type": "NodePort", "ports": [{"port": 3000, "targetPort": 3000, "nodePort": 30002}]}}'
쿼리문 이해하기
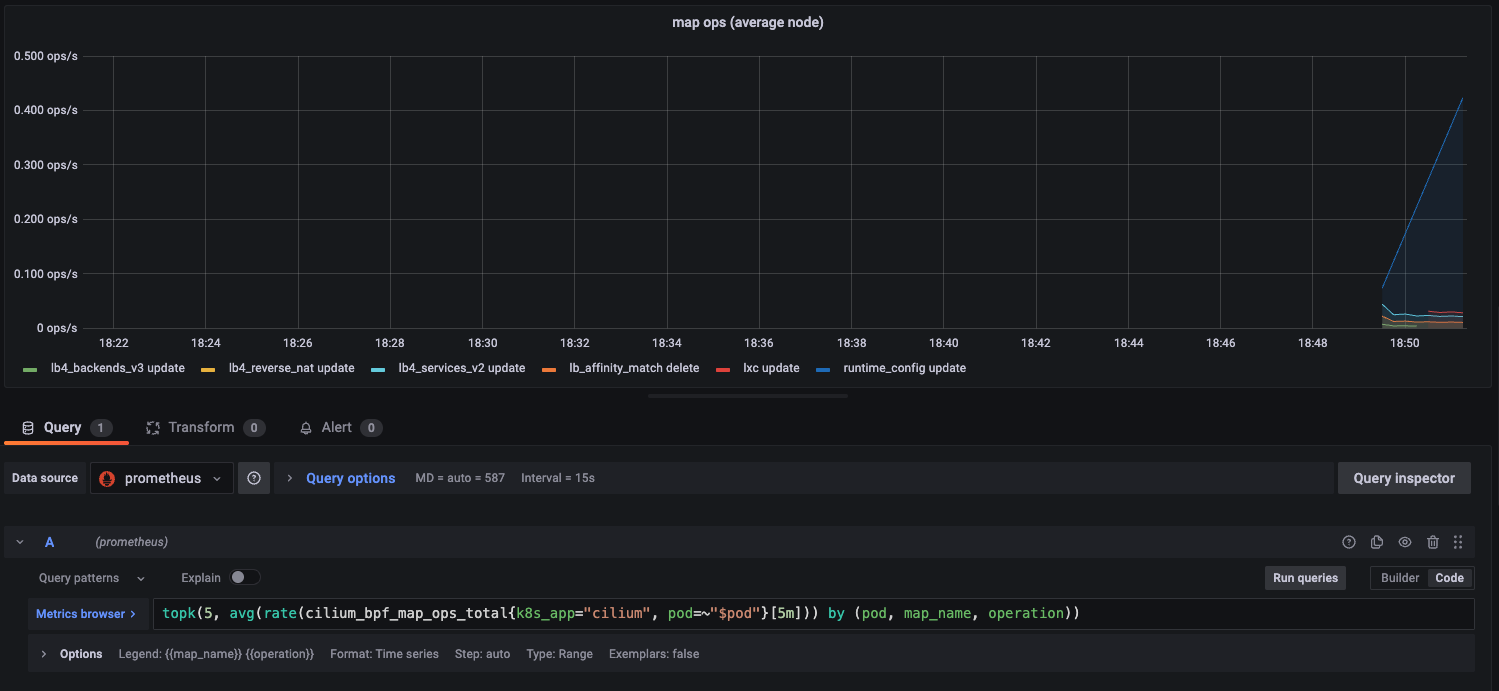
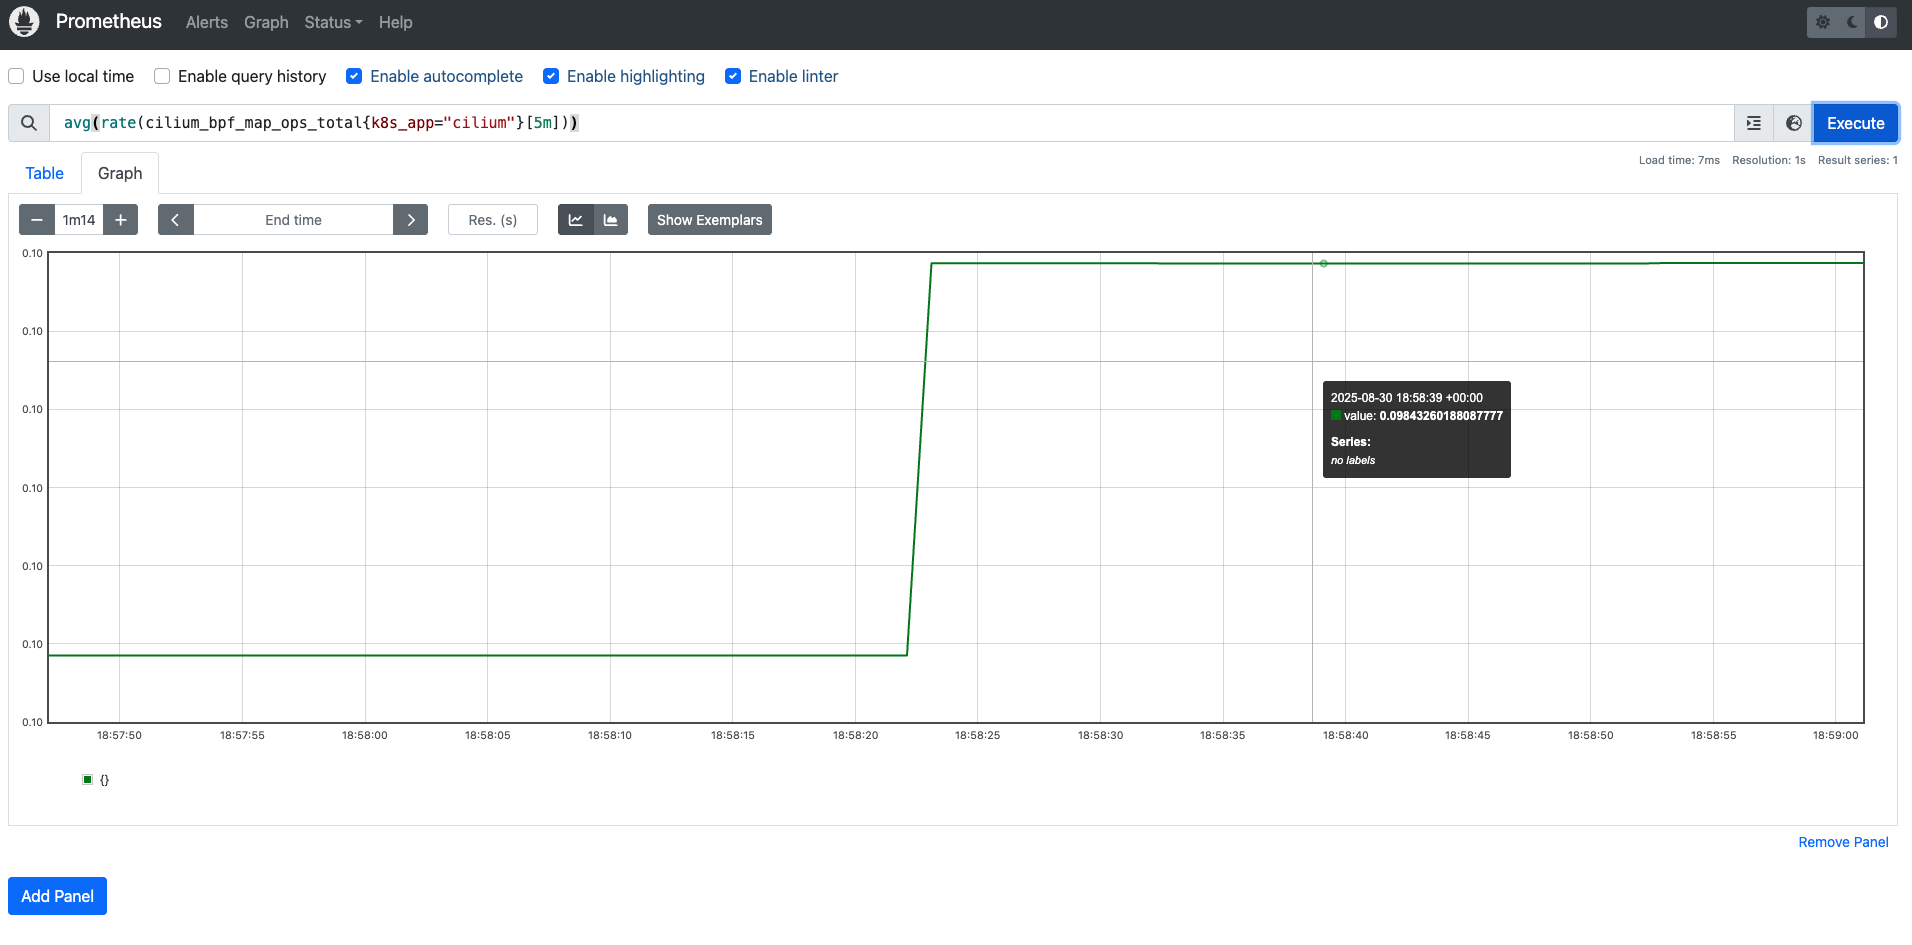
topk(5, avg(rate(cilium_bpf_map_ops_total{k8s_app="cilium", pod=~"$pod"}[5m])) by (pod, map_name, operation))
다음 쿼리문은 최근 5분 동안 Cilium Pod에서 발생한 BPF map 연산 중, Pod·맵·연산별로 초당 평균 연산 횟수를 계산한 뒤, 그 중 상위 5개를 보여달라는 의미를 나타냅니다.
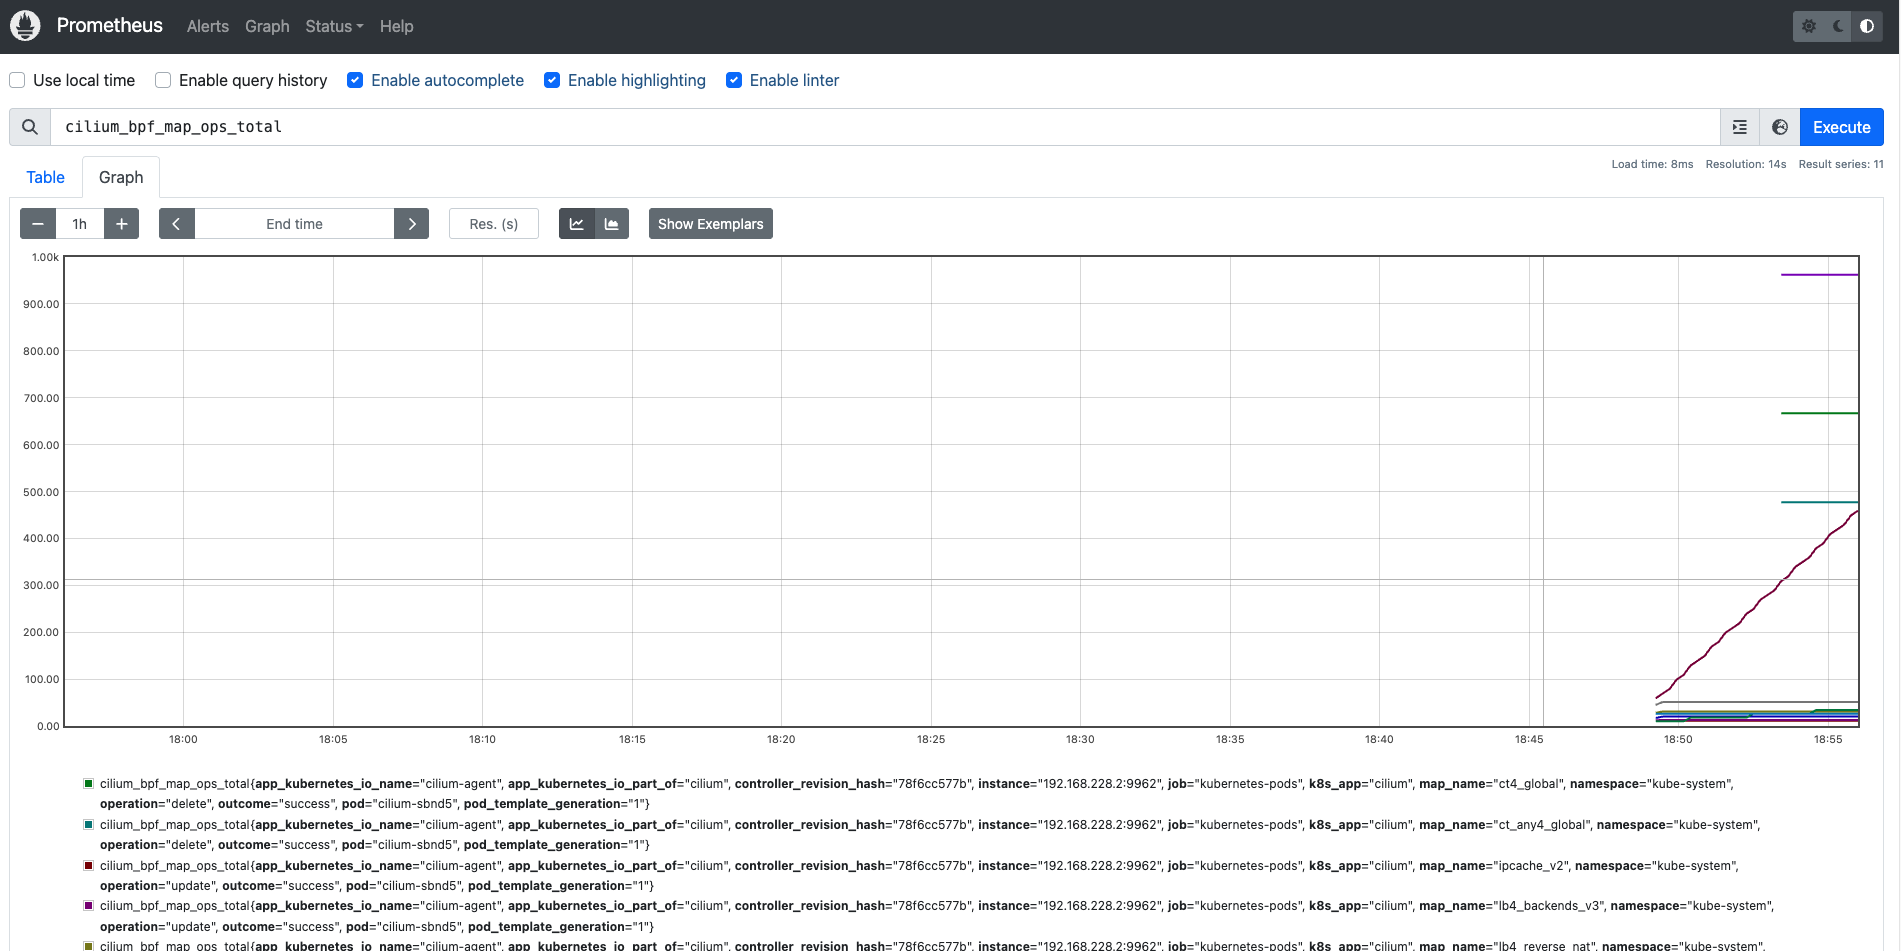
1) cilium_bpf_map_ops_total
- 메트릭 이름
- Cilium이 eBPF 맵(BPF map)에 대해 수행한 연산 횟수(total counter) 를 기록하는 카운터형 메트릭
- 라벨 정보:
- pod : 어느 Cilium pod에서 발생했는지
- map_name : 어떤 BPF map에 대한 연산인지
- operation : 연산 종류 (lookup, update, delete …)
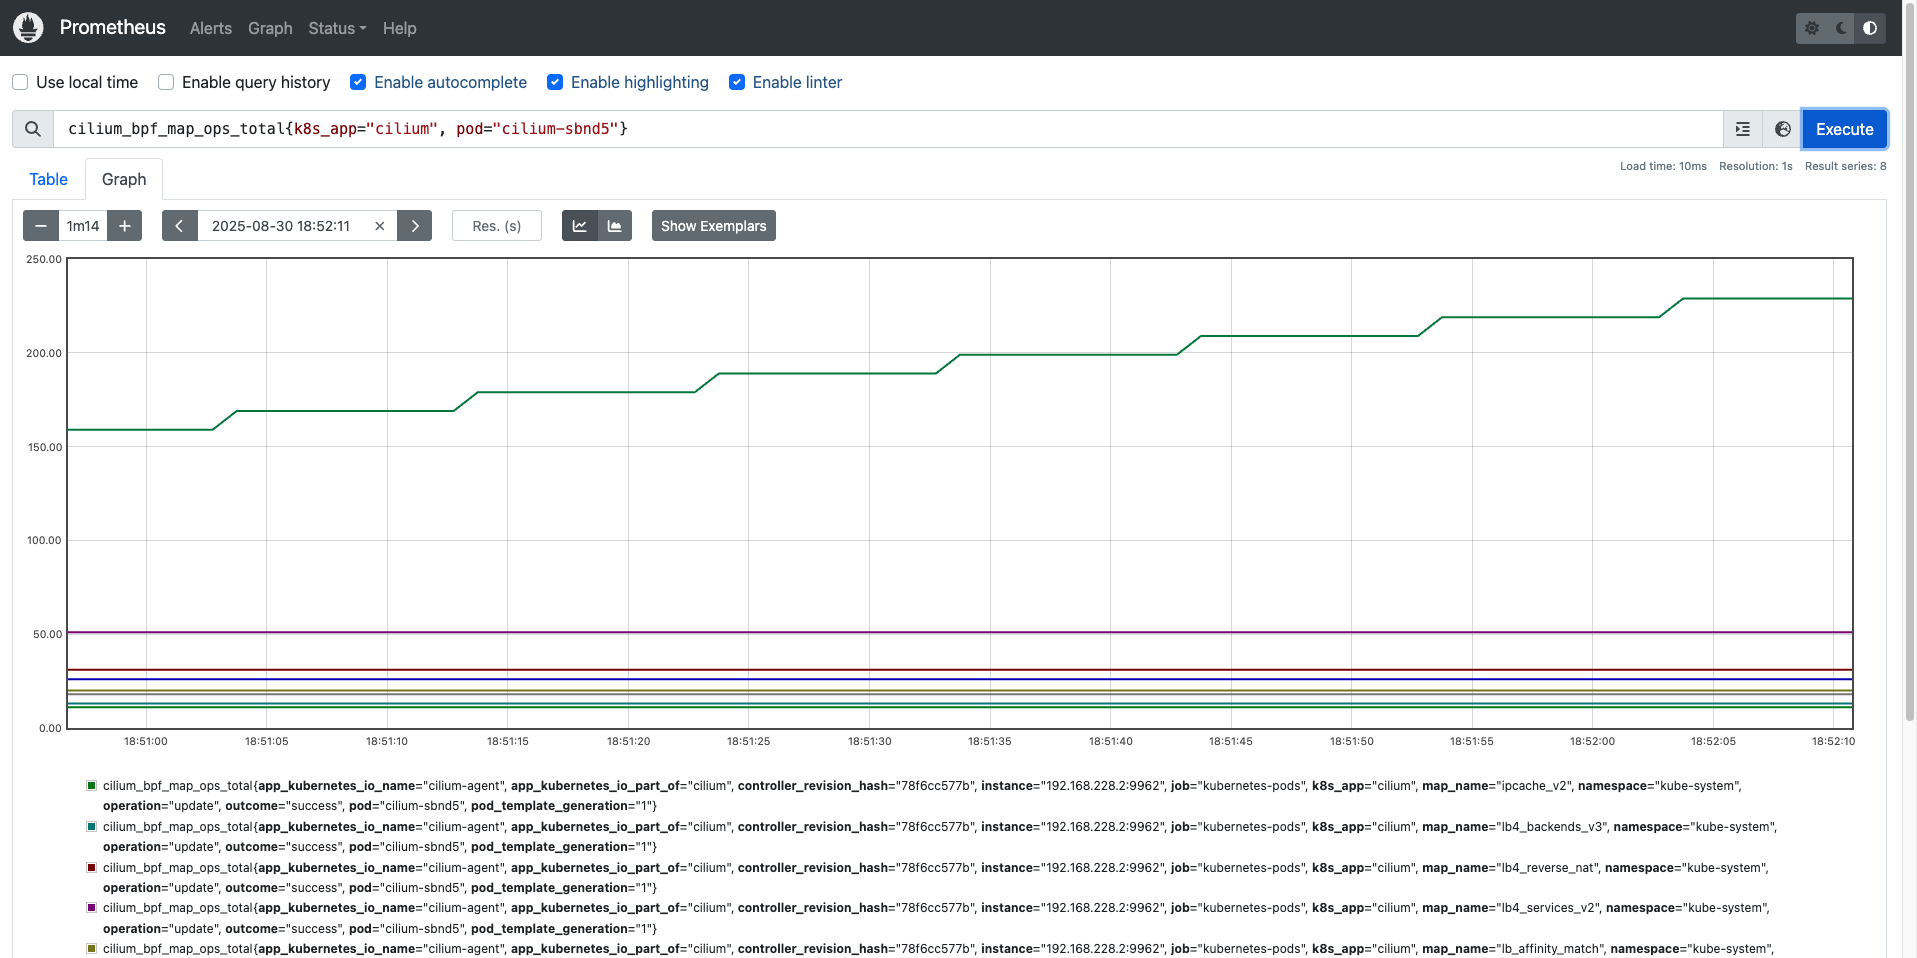
2) {k8s_app="cilium", pod=~"$pod"}
- 라벨 필터링
- k8s_app="cilium" : Cilium Pod에서 발생한 메트릭만 선택
- pod=~"$pod" : Grafana 변수 $pod에 매칭되는 Pod만 선택 (정규식 매칭)
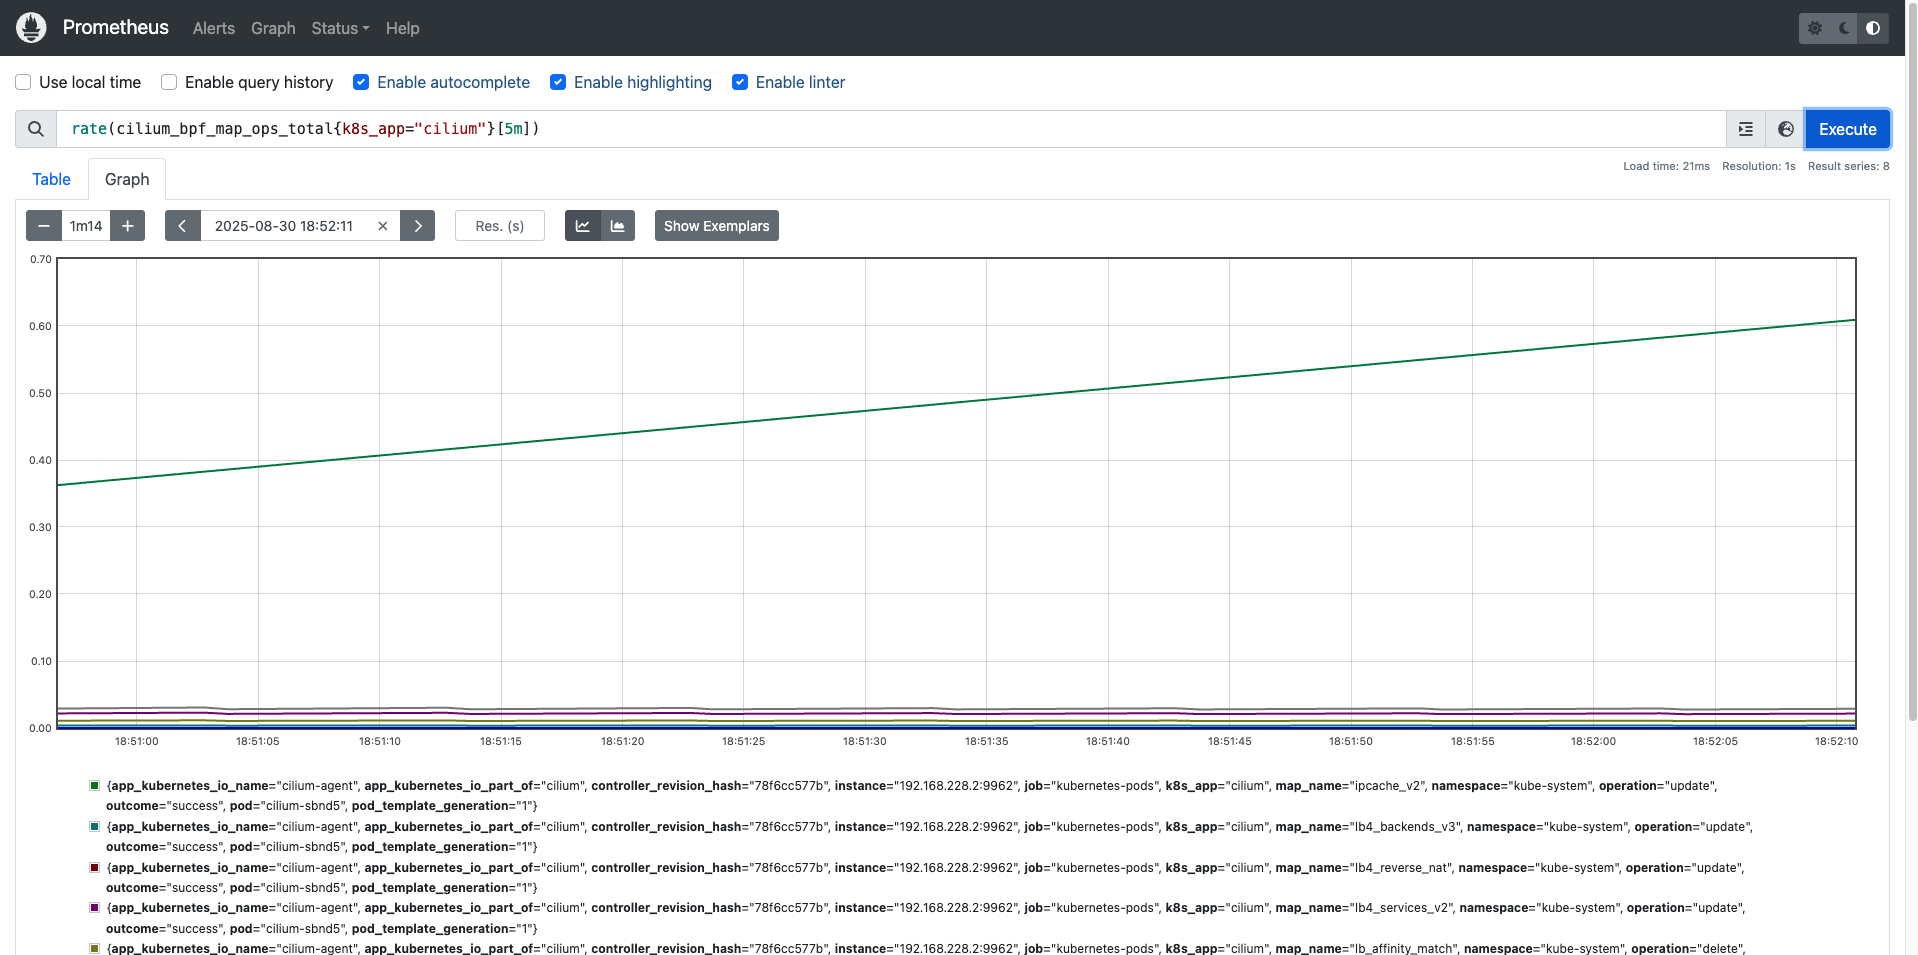
3) rate(...[5m])
- 카운터 메트릭 → 속도(초당 증가율) 변환
- cilium_bpf_map_ops_total은 누적값(counter)이므로, 단순 값은 의미가 없어요.
- rate(...[5m]) : 최근 5분 동안의 초당 증가율을 계산 → “초당 몇 번의 map 연산이 발생했는가” 로 해석 가능
4) avg(...) by (pod, map_name, operation)
- 동일한 (pod, map_name, operation) 조합별로 평균값을 집계
- 즉, 특정 Pod에서 어떤 map에 대해 어떤 연산이 얼마나 평균적으로 발생하는가를 구함
5) topk(5, …)
- 계산된 값 중 상위 5개만 출력
- 예: 가장 많은 연산이 일어난 BPF map 연산 5개
이 메트릭을 프로메테우스 쿼리를 보면서 확인해보겠습니다.
쿠버네티스 환경에서 속도 측정 테스트
iperf3는 네트워크 성능 벤치마크 도구로, TCP/UDP 기반의 대역폭, 지터, 패킷 손실률 등을 측정할 수 있습니다.
쿠버네티스 환경에서도 Pod 간 통신 성능을 확인할 때 자주 사용됩니다.
# 배포
> cat <<EOF | kubectl apply -f -
apiVersion: apps/v1
kind: Deployment
metadata:
  name: iperf3-server
spec:
  selector:
    matchLabels:
      app: iperf3-server
  replicas: 1
  template:
    metadata:
      labels:
        app: iperf3-server
    spec:
      containers:
      - name: iperf3-server
        image: networkstatic/iperf3
        args: ["-s"]
        ports:
        - containerPort: 5201
---
apiVersion: v1
kind: Service
metadata:
  name: iperf3-server
spec:
  selector:
    app: iperf3-server
  ports:
    - name: tcp-service
      protocol: TCP
      port: 5201
      targetPort: 5201
    - name: udp-service
      protocol: UDP
      port: 5201
      targetPort: 5201
  type: ClusterIP
---
apiVersion: apps/v1
kind: Deployment
metadata:
  name: iperf3-client
spec:
  selector:
    matchLabels:
      app: iperf3-client
  replicas: 1
  template:
    metadata:
      labels:
        app: iperf3-client
    spec:
      containers:
      - name: iperf3-client
        image: networkstatic/iperf3
        command: ["sleep"]
        args: ["infinity"]
EOF
deployment.apps/iperf3-server created
service/iperf3-server created
deployment.apps/iperf3-client created


# 확인 : 서버와 클라이언트가 어떤 노드에 배포되었는지 확인
kubectl get deploy,svc,pod -owide

NAME                            READY   UP-TO-DATE   AVAILABLE   AGE   CONTAINERS      IMAGES                 SELECTOR
deployment.apps/iperf3-client   1/1     1            1           18s   iperf3-client   networkstatic/iperf3   app=iperf3-client
deployment.apps/iperf3-server   1/1     1            1           18s   iperf3-server   networkstatic/iperf3   app=iperf3-server

NAME                    TYPE        CLUSTER-IP     EXTERNAL-IP   PORT(S)             AGE   SELECTOR
service/iperf3-server   ClusterIP   10.96.112.49   <none>        5201/TCP,5201/UDP   18s   app=iperf3-server
service/kubernetes      ClusterIP   10.96.0.1      <none>        443/TCP             15m   <none>

NAME                                 READY   STATUS    RESTARTS   AGE   IP             NODE                  NOMINATED NODE   READINESS GATES
pod/iperf3-client-688ff6565d-vj7pw   1/1     Running   0          18s   10.244.1.34    myk8s-control-plane   <none>           <none>
pod/iperf3-server-5d54b669cc-h7sl8   1/1     Running   0          18s   10.244.0.204   myk8s-control-plane   <none>           <none>
1) TCP 단방향 테스트 (기본 모드)
- 동작: client → server 로 TCP 스트림 1개를 5초간 송신
- 결과:
- 평균 ~54 Gbps 속도 확인
- Retr(재전송) 횟수가 수천 건 → 패킷 손실이나 혼잡제어로 인해 재전송 발생
- sender와 receiver 측정 값이 동일 → TCP는 신뢰성 보장 전송이므로 데이터 손실 없음
TCP는 혼잡 제어(Cwnd, Retransmit)에 따라 실제 성능이 영향을 받는다는 것을 알 수 있습니다.
# 클라이언트 파드에서 아래 명령 실행
> kubectl exec -it deploy/iperf3-client -- iperf3 -c iperf3-server -t 5

Connecting to host iperf3-server, port 5201
[  5] local 10.244.1.34 port 60780 connected to 10.96.112.49 port 5201
[ ID] Interval           Transfer     Bitrate         Retr  Cwnd
[  5]   0.00-1.00   sec  6.03 GBytes  51.8 Gbits/sec  678    655 KBytes
[  5]   1.00-2.00   sec  6.30 GBytes  54.1 Gbits/sec  704   1.17 MBytes
[  5]   2.00-3.00   sec  6.42 GBytes  55.1 Gbits/sec  1205   1.16 MBytes
[  5]   3.00-4.00   sec  6.45 GBytes  55.4 Gbits/sec  628   1.04 MBytes
[  5]   4.00-5.00   sec  6.33 GBytes  54.4 Gbits/sec  516   1.05 MBytes
- - - - - - - - - - - - - - - - - - - - - - - - -
[ ID] Interval           Transfer     Bitrate         Retr
[  5]   0.00-5.00   sec  31.5 GBytes  54.1 Gbits/sec  3731             sender
[  5]   0.00-5.00   sec  31.5 GBytes  54.1 Gbits/sec                  receiver

iperf Done.


# 서버 파드 로그 확인 : 기본 5201 포트 Listen
> kubectl logs -l app=iperf3-server -f
-----------------------------------------------------------
Server listening on 5201 (test #1)
-----------------------------------------------------------
Accepted connection from 10.244.1.34, port 60768
[  5] local 10.244.0.204 port 5201 connected to 10.244.1.34 port 60780
[ ID] Interval           Transfer     Bitrate
[  5]   0.00-1.00   sec  6.02 GBytes  51.8 Gbits/sec
[  5]   1.00-2.00   sec  6.30 GBytes  54.1 Gbits/sec
[  5]   2.00-3.00   sec  6.41 GBytes  55.1 Gbits/sec
[  5]   3.00-4.00   sec  6.45 GBytes  55.4 Gbits/sec
[  5]   4.00-5.00   sec  6.33 GBytes  54.4 Gbits/sec
[  5]   5.00-5.00   sec  3.62 MBytes  18.7 Gbits/sec
- - - - - - - - - - - - - - - - - - - - - - - - -
[ ID] Interval           Transfer     Bitrate
[  5]   0.00-5.00   sec  31.5 GBytes  54.1 Gbits/sec                  receiver
2) UDP 사용, 역방향 모드(-R)
- 동작: client → server 로 UDP 트래픽을 목표 대역폭(20Gbps)으로 송신
- 결과:
- client 송신 기준: 3.2 Gbps 전송 성공
- server 수신 기준: 1.38 Gbps만 수신 (57% 손실)
- Jitter는 0ms 수준 → 지터는 안정적이나, 손실률이 매우 큼
UDP는 신뢰성 보장이 없어 손실이 바로 드러나는 것을 알 수 있습니다.
> kubectl exec -it deploy/iperf3-client -- iperf3 -c iperf3-server -u -b 20G

Connecting to host iperf3-server, port 5201
[  5] local 10.244.1.34 port 54994 connected to 10.96.112.49 port 5201
[ ID] Interval           Transfer     Bitrate         Total Datagrams
[  5]   0.00-1.00   sec   397 MBytes  3.33 Gbits/sec  287487
[  5]   1.00-2.00   sec   371 MBytes  3.11 Gbits/sec  268600
[  5]   2.00-3.00   sec   323 MBytes  2.71 Gbits/sec  233792
[  5]   3.00-4.00   sec   378 MBytes  3.17 Gbits/sec  273661
[  5]   4.00-5.00   sec   372 MBytes  3.12 Gbits/sec  269267
[  5]   5.00-6.00   sec   402 MBytes  3.37 Gbits/sec  290937
[  5]   6.00-7.00   sec   409 MBytes  3.43 Gbits/sec  296220
[  5]   7.00-8.00   sec   403 MBytes  3.38 Gbits/sec  292149
[  5]   8.00-9.00   sec   405 MBytes  3.39 Gbits/sec  292948
[  5]   9.00-10.00  sec   391 MBytes  3.28 Gbits/sec  283167
- - - - - - - - - - - - - - - - - - - - - - - - -
[ ID] Interval           Transfer     Bitrate         Jitter    Lost/Total Datagrams
[  5]   0.00-10.00  sec  3.76 GBytes  3.23 Gbits/sec  0.000 ms  0/2788228 (0%)  sender
[  5]   0.00-10.00  sec  1.61 GBytes  1.38 Gbits/sec  0.000 ms  1593901/2787362 (57%)  receiver

iperf Done.


> kubectl logs -l app=iperf3-server -f
-----------------------------------------------------------
Server listening on 5201 (test #2)
-----------------------------------------------------------
Accepted connection from 10.244.1.34, port 50736
[  5] local 10.244.0.204 port 5201 connected to 10.244.1.34 port 54994
[ ID] Interval           Transfer     Bitrate         Jitter    Lost/Total Datagrams
[  5]   0.00-1.00   sec   166 MBytes  1.40 Gbits/sec  0.002 ms  167003/287486 (58%)
[  5]   1.00-2.00   sec   154 MBytes  1.29 Gbits/sec  0.096 ms  157170/268436 (59%)
[  5]   2.00-3.00   sec   133 MBytes  1.12 Gbits/sec  0.143 ms  137238/233572 (59%)
[  5]   3.00-4.00   sec   162 MBytes  1.36 Gbits/sec  0.006 ms  157074/274040 (57%)
[  5]   4.00-5.00   sec   166 MBytes  1.40 Gbits/sec  0.000 ms  148829/269271 (55%)
[  5]   5.00-6.00   sec   173 MBytes  1.45 Gbits/sec  0.034 ms  165514/290920 (57%)
[  5]   6.00-7.00   sec   175 MBytes  1.47 Gbits/sec  0.208 ms  168177/294898 (57%)
[  5]   7.00-8.00   sec   177 MBytes  1.48 Gbits/sec  0.191 ms  164541/292408 (56%)
[  5]   8.00-9.00   sec   180 MBytes  1.50 Gbits/sec  0.189 ms  163227/293238 (56%)
[  5]   9.00-10.00  sec   163 MBytes  1.37 Gbits/sec  0.000 ms  165128/283093 (58%)
- - - - - - - - - - - - - - - - - - - - - - - - -
[ ID] Interval           Transfer     Bitrate         Jitter    Lost/Total Datagrams
[  5]   0.00-10.00  sec  1.61 GBytes  1.38 Gbits/sec  0.000 ms  1593901/2787362 (57%)  receiver
3) TCP, 쌍방향 모드(-R)
- 동작: client→server, server→client 양쪽으로 동시에 TCP 스트림 송수신
- 결과:
- client 송신(TX-C): 평균 ~14.8 Gbps
- client 수신(RX-C): 평균 ~14.4 Gbps
- server 송신(TX-S): 평균 ~14.4 Gbps
- server 수신(RX-S): 평균 ~14.8 Gbps
- 총합 약 29 Gbps (14~15 Gbps × 2 방향)
양방향 모드에서는 링크 대역폭이 절반 수준으로 분배되며, 양쪽 송수신에서 Retr(재전송)이 발생할 수 있다는 것을 알 수 있습니다.
> kubectl exec -it deploy/iperf3-client -- iperf3 -c iperf3-server -t 5 --bidir

Connecting to host iperf3-server, port 5201
[  5] local 10.244.1.34 port 57120 connected to 10.96.112.49 port 5201
[  7] local 10.244.1.34 port 57130 connected to 10.96.112.49 port 5201
[ ID][Role] Interval           Transfer     Bitrate         Retr  Cwnd
[  5][TX-C]   0.00-1.00   sec  3.05 GBytes  26.2 Gbits/sec  2540    806 KBytes
[  7][RX-C]   0.00-1.00   sec  2.77 GBytes  23.8 Gbits/sec
[  5][TX-C]   1.00-2.00   sec  2.24 GBytes  19.2 Gbits/sec  1286    707 KBytes
[  7][RX-C]   1.00-2.00   sec  2.10 GBytes  18.0 Gbits/sec
[  5][TX-C]   2.00-3.00   sec  1.02 GBytes  8.76 Gbits/sec  431   1.06 MBytes
[  7][RX-C]   2.00-3.00   sec  1.22 GBytes  10.5 Gbits/sec
[  5][TX-C]   3.00-4.00   sec  1.48 GBytes  12.7 Gbits/sec  535    711 KBytes
[  7][RX-C]   3.00-4.00   sec  1.30 GBytes  11.2 Gbits/sec
[  5][TX-C]   4.00-5.00   sec   852 MBytes  7.15 Gbits/sec  552    344 KBytes
[  7][RX-C]   4.00-5.00   sec   999 MBytes  8.38 Gbits/sec
- - - - - - - - - - - - - - - - - - - - - - - - -
[ ID][Role] Interval           Transfer     Bitrate         Retr
[  5][TX-C]   0.00-5.00   sec  8.62 GBytes  14.8 Gbits/sec  5344             sender
[  5][TX-C]   0.00-5.00   sec  8.62 GBytes  14.8 Gbits/sec                  receiver
[  7][RX-C]   0.00-5.00   sec  8.37 GBytes  14.4 Gbits/sec  1942             sender
[  7][RX-C]   0.00-5.00   sec  8.37 GBytes  14.4 Gbits/sec                  receiver

iperf Done.


> kubectl logs -l app=iperf3-server -f
-----------------------------------------------------------
Server listening on 5201 (test #3)
-----------------------------------------------------------
Accepted connection from 10.244.1.34, port 57108
[  5] local 10.244.0.204 port 5201 connected to 10.244.1.34 port 57120
[  8] local 10.244.0.204 port 5201 connected to 10.244.1.34 port 57130
[ ID][Role] Interval           Transfer     Bitrate         Retr  Cwnd
[  5][RX-S]   0.00-1.00   sec  3.05 GBytes  26.2 Gbits/sec
[  8][TX-S]   0.00-1.00   sec  2.77 GBytes  23.8 Gbits/sec  396    960 KBytes
[  5][RX-S]   1.00-2.01   sec  2.23 GBytes  19.1 Gbits/sec
[  8][TX-S]   1.00-2.01   sec  2.10 GBytes  17.9 Gbits/sec  516    745 KBytes
[  5][RX-S]   2.01-3.00   sec  1.02 GBytes  8.83 Gbits/sec
[  8][TX-S]   2.01-3.00   sec  1.22 GBytes  10.5 Gbits/sec   67    911 KBytes
[  5][RX-S]   3.00-4.00   sec  1.48 GBytes  12.7 Gbits/sec
[  8][TX-S]   3.00-4.00   sec  1.30 GBytes  11.2 Gbits/sec  175    807 KBytes
[  5][RX-S]   4.00-5.00   sec   856 MBytes  7.18 Gbits/sec
[  8][TX-S]   4.00-5.00   sec   996 MBytes  8.35 Gbits/sec  788    732 KBytes
- - - - - - - - - - - - - - - - - - - - - - - - -
[ ID][Role] Interval           Transfer     Bitrate         Retr
[  5][RX-S]   0.00-5.00   sec  8.62 GBytes  14.8 Gbits/sec                  receiver
[  8][TX-S]   0.00-5.00   sec  8.37 GBytes  14.4 Gbits/sec  1942             sender
4) TCP 다중 스트림(30개), -P(number of parallel client streams to run)
- 동작: TCP 스트림 2개를 병렬 실행 (멀티 커넥션 상황)
- 결과:
- 각 스트림은 ~32 Gbps → 합산 64 Gbps 근처
- Retr(재전송) 횟수는 개별 스트림에서 많음 (3천 건/초)
- 서버 로그에서도 합산 64 Gbps 확인
단일 스트림으로는 대역폭을 다 못 쓰는 경우가 많기 때문에 멀티 스트림(-P 옵션)을 주면 네트워크 스택/큐 병렬화로 성능이 더 높게 나오는 것을 알 수 있습니다.
> kubectl exec -it deploy/iperf3-client -- iperf3 -c iperf3-server -t 10 -P 2

Connecting to host iperf3-server, port 5201
[  5] local 10.244.1.34 port 54498 connected to 10.96.112.49 port 5201
[  7] local 10.244.1.34 port 54512 connected to 10.96.112.49 port 5201
[ ID] Interval           Transfer     Bitrate         Retr  Cwnd
[  5]   0.00-1.00   sec  3.91 GBytes  33.6 Gbits/sec  676    745 KBytes
[  7]   0.00-1.00   sec  3.86 GBytes  33.1 Gbits/sec  1002    700 KBytes
[SUM]   0.00-1.00   sec  7.77 GBytes  66.7 Gbits/sec  1678
- - - - - - - - - - - - - - - - - - - - - - - - -
[  5]   1.00-2.00   sec  3.80 GBytes  32.6 Gbits/sec  727    467 KBytes
[  7]   1.00-2.00   sec  3.78 GBytes  32.5 Gbits/sec  1491    680 KBytes
[SUM]   1.00-2.00   sec  7.58 GBytes  65.1 Gbits/sec  2218
- - - - - - - - - - - - - - - - - - - - - - - - -
[  5]   2.00-3.00   sec  3.89 GBytes  33.4 Gbits/sec  2109    471 KBytes
[  7]   2.00-3.00   sec  3.86 GBytes  33.2 Gbits/sec  962    462 KBytes
[SUM]   2.00-3.00   sec  7.76 GBytes  66.6 Gbits/sec  3071
- - - - - - - - - - - - - - - - - - - - - - - - -
[  5]   3.00-4.00   sec  3.38 GBytes  29.1 Gbits/sec  2651    369 KBytes
[  7]   3.00-4.00   sec  3.34 GBytes  28.7 Gbits/sec  1341    539 KBytes
[SUM]   3.00-4.00   sec  6.72 GBytes  57.7 Gbits/sec  3992
- - - - - - - - - - - - - - - - - - - - - - - - -
[  5]   4.00-5.00   sec  3.65 GBytes  31.4 Gbits/sec  1422    537 KBytes
[  7]   4.00-5.00   sec  3.66 GBytes  31.4 Gbits/sec  734    465 KBytes
[SUM]   4.00-5.00   sec  7.31 GBytes  62.8 Gbits/sec  2156
- - - - - - - - - - - - - - - - - - - - - - - - -
[  5]   5.00-6.00   sec  3.81 GBytes  32.7 Gbits/sec  1923    503 KBytes
[  7]   5.00-6.00   sec  3.79 GBytes  32.5 Gbits/sec  902    392 KBytes
[SUM]   5.00-6.00   sec  7.60 GBytes  65.3 Gbits/sec  2825
- - - - - - - - - - - - - - - - - - - - - - - - -
[  5]   6.00-7.00   sec  3.71 GBytes  31.9 Gbits/sec  1239    515 KBytes
[  7]   6.00-7.00   sec  3.70 GBytes  31.8 Gbits/sec  830    322 KBytes
[SUM]   6.00-7.00   sec  7.41 GBytes  63.7 Gbits/sec  2069
- - - - - - - - - - - - - - - - - - - - - - - - -
[  5]   7.00-8.00   sec  3.79 GBytes  32.5 Gbits/sec  1020    481 KBytes
[  7]   7.00-8.00   sec  3.70 GBytes  31.8 Gbits/sec  1359    494 KBytes
[SUM]   7.00-8.00   sec  7.49 GBytes  64.3 Gbits/sec  2379
- - - - - - - - - - - - - - - - - - - - - - - - -
[  5]   8.00-9.00   sec  4.14 GBytes  35.6 Gbits/sec  1995    378 KBytes
[  7]   8.00-9.00   sec  4.09 GBytes  35.2 Gbits/sec  824    601 KBytes
[SUM]   8.00-9.00   sec  8.23 GBytes  70.8 Gbits/sec  2819
- - - - - - - - - - - - - - - - - - - - - - - - -
[  5]   9.00-10.00  sec  3.41 GBytes  29.3 Gbits/sec  1534    617 KBytes
[  7]   9.00-10.00  sec  3.34 GBytes  28.7 Gbits/sec  1203    359 KBytes
[SUM]   9.00-10.00  sec  6.75 GBytes  58.0 Gbits/sec  2737
- - - - - - - - - - - - - - - - - - - - - - - - -
[ ID] Interval           Transfer     Bitrate         Retr
[  5]   0.00-10.00  sec  37.5 GBytes  32.2 Gbits/sec  15296             sender
[  5]   0.00-10.00  sec  37.5 GBytes  32.2 Gbits/sec                  receiver
[  7]   0.00-10.00  sec  37.1 GBytes  31.9 Gbits/sec  10648             sender
[  7]   0.00-10.00  sec  37.1 GBytes  31.9 Gbits/sec                  receiver
[SUM]   0.00-10.00  sec  74.6 GBytes  64.1 Gbits/sec  25944             sender
[SUM]   0.00-10.00  sec  74.6 GBytes  64.1 Gbits/sec                  receiver

iperf Done.


> kubectl logs -l app=iperf3-server -f
-----------------------------------------------------------
Server listening on 5201 (test #4)
-----------------------------------------------------------
Accepted connection from 10.244.1.34, port 54488
[  5] local 10.244.0.204 port 5201 connected to 10.244.1.34 port 54498
[  8] local 10.244.0.204 port 5201 connected to 10.244.1.34 port 54512
[ ID] Interval           Transfer     Bitrate
[  5]   0.00-1.00   sec  3.90 GBytes  33.5 Gbits/sec
[  8]   0.00-1.00   sec  3.85 GBytes  33.1 Gbits/sec
[SUM]   0.00-1.00   sec  7.75 GBytes  66.6 Gbits/sec
- - - - - - - - - - - - - - - - - - - - - - - - -
[  5]   1.00-2.00   sec  3.80 GBytes  32.6 Gbits/sec
[  8]   1.00-2.00   sec  3.78 GBytes  32.5 Gbits/sec
[SUM]   1.00-2.00   sec  7.57 GBytes  65.1 Gbits/sec
- - - - - - - - - - - - - - - - - - - - - - - - -
[  5]   2.00-3.00   sec  3.89 GBytes  33.5 Gbits/sec
[  8]   2.00-3.00   sec  3.86 GBytes  33.2 Gbits/sec
[SUM]   2.00-3.00   sec  7.75 GBytes  66.6 Gbits/sec
- - - - - - - - - - - - - - - - - - - - - - - - -
[  5]   3.00-4.00   sec  3.38 GBytes  29.1 Gbits/sec
[  8]   3.00-4.00   sec  3.34 GBytes  28.7 Gbits/sec
[SUM]   3.00-4.00   sec  6.72 GBytes  57.7 Gbits/sec
- - - - - - - - - - - - - - - - - - - - - - - - -
[  5]   4.00-5.00   sec  3.65 GBytes  31.4 Gbits/sec
[  8]   4.00-5.00   sec  3.66 GBytes  31.4 Gbits/sec
[SUM]   4.00-5.00   sec  7.31 GBytes  62.8 Gbits/sec
- - - - - - - - - - - - - - - - - - - - - - - - -
[  5]   5.00-6.00   sec  3.81 GBytes  32.7 Gbits/sec
[  8]   5.00-6.00   sec  3.79 GBytes  32.5 Gbits/sec
[SUM]   5.00-6.00   sec  7.60 GBytes  65.3 Gbits/sec
- - - - - - - - - - - - - - - - - - - - - - - - -
[  5]   6.00-7.00   sec  3.71 GBytes  31.9 Gbits/sec
[  8]   6.00-7.00   sec  3.70 GBytes  31.8 Gbits/sec
[SUM]   6.00-7.00   sec  7.41 GBytes  63.7 Gbits/sec
- - - - - - - - - - - - - - - - - - - - - - - - -
[  5]   7.00-8.00   sec  3.79 GBytes  32.5 Gbits/sec
[  8]   7.00-8.00   sec  3.70 GBytes  31.8 Gbits/sec
[SUM]   7.00-8.00   sec  7.49 GBytes  64.3 Gbits/sec
- - - - - - - - - - - - - - - - - - - - - - - - -
[  5]   8.00-9.00   sec  4.14 GBytes  35.6 Gbits/sec
[  8]   8.00-9.00   sec  4.09 GBytes  35.2 Gbits/sec
[SUM]   8.00-9.00   sec  8.24 GBytes  70.7 Gbits/sec
- - - - - - - - - - - - - - - - - - - - - - - - -
[  5]   9.00-10.00  sec  3.41 GBytes  29.3 Gbits/sec
[  8]   9.00-10.00  sec  3.34 GBytes  28.7 Gbits/sec
[SUM]   9.00-10.00  sec  6.75 GBytes  58.0 Gbits/sec
- - - - - - - - - - - - - - - - - - - - - - - - -
[  5]  10.00-10.00  sec  2.62 MBytes  27.8 Gbits/sec
[  8]  10.00-10.00  sec  2.62 MBytes  29.2 Gbits/sec
[SUM]  10.00-10.00  sec  5.25 MBytes  55.5 Gbits/sec
- - - - - - - - - - - - - - - - - - - - - - - - -
[ ID] Interval           Transfer     Bitrate
[  5]   0.00-10.00  sec  37.5 GBytes  32.2 Gbits/sec                  receiver
[  8]   0.00-10.00  sec  37.1 GBytes  31.9 Gbits/sec                  receiver
[SUM] 0.00-10.00 sec 74.6 GBytes 64.1 Gbits/sec receiver'스터디 > Cilium' 카테고리의 다른 글
| [Cilium] Tetragon (3) | 2025.09.07 |
|---|---|
| [Cilium] Cilium Security (0) | 2025.09.07 |
| [Cilium] K8s Performance with Kube-burner (1) | 2025.08.31 |
| [Cilium] Gateway API (2) | 2025.08.24 |
| [Cilium] Cilium Ingress (4) | 2025.08.23 |